What Are the Top Air Pollution Detection Drones in 2026?

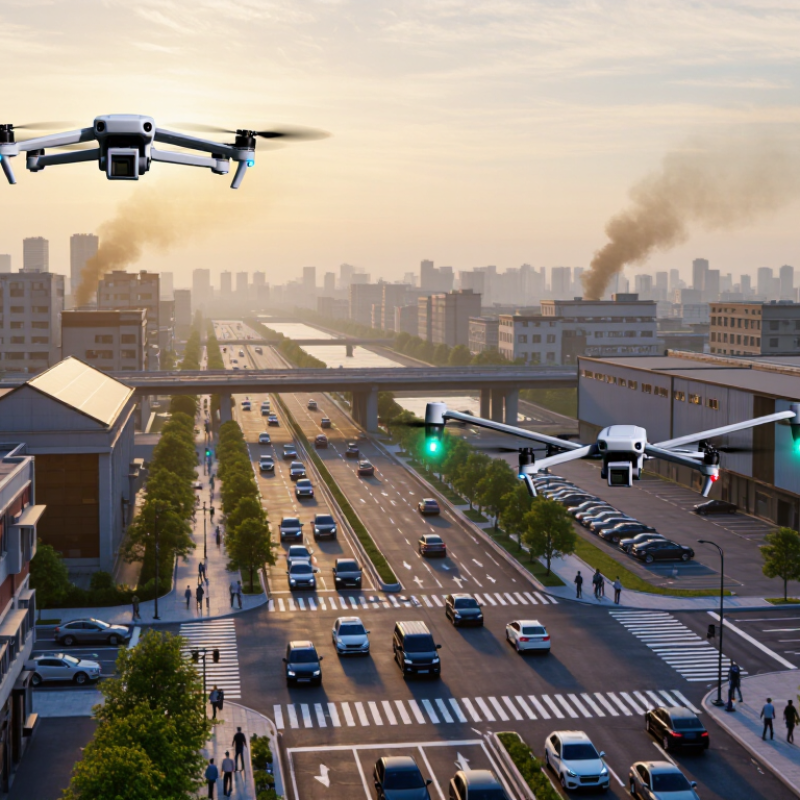
In 2026, Air Pollution Detection Drones are moving from demonstrations toward practical, targeted monitoring. They can carry compact sensors above roads, industrial edges, and wildfire smoke, capturing conditions that fixed stations may miss. A flight over a busy junction, for example, can map changing pollution levels block by block. But altitude, humidity, sensor drift, and battery limits can distort a reading. Small errors matter.

The World Health Organization estimated that ambient air pollution caused 4.2 million premature deaths in 2019. The State of Global Air 2024 report attributed 8.1 million deaths worldwide to total air pollution in 2021. These figures explain the urgency, not the accuracy of any individual drone. Dr. Maria Neira, a public-health expert and former WHO Director of Environment, Climate Change and Health, described air pollution as “one of the biggest environmental threats to human health, alongside climate change.” Her warning sets the health context; it does not prove that aerial sensors outperform ground monitors.

This guide compares leading platforms by pollutant coverage, sensor quality, flight endurance, mapping tools, and validation practices. It also asks an awkward question: can a drone produce data decision-makers can trust after landing? No sensor is magic. Look for calibration records, side-by-side tests, and clearly stated limitations—not polished maps alone.
What Are the Top Air Pollution Detection Drones in 2026?

How Air Pollution Detection Drones Collect Environmental Data

What Are the Top Air Pollution Detection Drones in 2026?

Air pollution detection drones collect measurements where fixed stations cannot easily reach, including rooftops, road corridors, and different heights above ground. Their value comes from the sensor payload and sampling method, not simply flight range. Depending on the study, instruments may measure fine particles, ozone, nitrogen dioxide, or other gases. GPS coordinates and timestamps link each reading to a place and moment.

During a survey, a drone follows a planned route while sensors record air measurements and, when available, temperature, humidity, and wind. Operators can compare readings across streets or altitude bands. Short, repeated flights help reveal patterns. But sensor response takes time, so fast movement may blur a local pollution plume. Rotor wash can also disturb nearby air, especially during hovering or low-altitude sampling.

Reliable results need careful checks. Teams should compare drone readings with calibrated reference instruments before and after flights, and note weather and flight height. Humidity may affect particle sensors; gas sensors can drift. A detailed map is useful, but not automatically accurate. That is the catch. Even well-collected data may miss brief emissions or reflect the drone’s own airflow, so conclusions should state these limits.

Key Sensors Used to Measure Air Pollutants from the Air

Air pollution detection drones are only as useful as their payload. A compact optical particle counter estimates PM1, PM2.5, and PM10 by measuring scattered light. It can reveal a dust plume near a road or worksite within minutes. But droplets and high humidity may inflate readings, so log humidity and treat sudden spikes carefully.

Gas sensors answer different questions. Electrochemical cells can detect gases such as nitrogen dioxide, ozone, carbon monoxide, or sulfur dioxide, depending on the sensor installed. A nondispersive infrared sensor can measure carbon dioxide, while a photoionization detector responds to many volatile organic compounds. It does not identify each compound. Small differences matter. Record response time, cross-sensitivity, and calibration history with each flight; otherwise, a neat map may suggest more certainty than the data supports.

Temperature, humidity, and pressure sensors help interpret changing readings. The air inlet also matters: rotor wash can mix or dilute the sample. Compare drone measurements with a ground reference, and repeat routes at similar heights and speeds. There are blind spots. Even a careful setup may miss brief, localized pollution between sampling points.

Criteria for Comparing Air Pollution Detection Drones in 2026

A useful comparison starts with the pollutants a drone can measure, not the number of sensors listed on its specification sheet. Check whether the payload detects fine particles such as PM2.5, larger particles such as PM10, or gases like nitrogen dioxide and ozone. Look for stated detection limits, response times, and calibration procedures. A sensor that reacts slowly may blur a short pollution plume across several locations. Small details matter.

Flight performance affects the quality of the readings. Compare practical flight time with the weight of the full sensor package, since advertised endurance may not reflect a working survey. Consider operating altitude, positioning accuracy, and whether measurements are time-stamped and geotagged. Wind can shift a plume between passes. Temperature and humidity can also affect some low-cost particle sensors, so reliable systems should record these conditions alongside pollutant data.

Data quality deserves equal attention. Ask how often instruments need calibration against a trusted reference, and whether the software flags missing or questionable readings. Repeat flights over the same route can reveal inconsistent results, though they do not remove every source of error. A neat map can still mislead. Drone measurements are best treated as localized, time-specific evidence, not automatic replacements for fixed monitoring stations. Compare how clearly each system documents its limits, too; that part is easy to overlook.

What Are the Top Air Pollution Detection Drones in 2026?

Criteria for Comparing Air Pollution Detection Drones in 2026

Use these WHO guideline concentrations as reference benchmarks when evaluating a drone’s sensors. Compare measurement accuracy against reference instruments, detection range, time resolution, calibration needs, and flight endurance. The bars represent different pollutants and averaging periods, so they are not direct measures of drone performance.

Source: WHO Global Air Quality Guidelines, 2021. Concentrations are in µg/m³.

Leading Drone Platforms for Air Pollution Monitoring in 2026

Leading Drone Platforms for Air Pollution Monitoring in 2026

Air-pollution monitoring drones work best when matched to the question. Multirotor platforms hover over roads, construction sites, or industrial boundaries, measuring changes across short distances. Fixed-wing platforms cover wider areas and suit regional plume surveys, but offer less control over individual sampling points. Tethered systems can hold position above a site for longer periods. Useful, but imperfect.

Sensor choice matters as much as flight time. The World Health Organization’s 2021 air-quality guidelines set annual PM2.5 at 5 micrograms per cubic metre and the 24-hour level at 15. Optical particle sensors can map rapid changes, but humidity may distort readings. Gas sensors need calibration and careful placement. Rotor wash can also disturb a plume, so operators should compare drone readings with ground instruments.

The scale of the problem supports careful monitoring: WHO estimates that ambient air pollution caused 4.2 million premature deaths worldwide in 2019. That figure comes from its air-pollution fact sheet, not from drone measurements. For credible surveys, teams should record altitude, wind, temperature, and sensor response alongside each reading. A drone can reveal a sharp roadside spike; it cannot, by itself, prove a source or replace validated monitoring stations. Some gaps remain, especially when wind shifts mid-flight.

Applications and Limitations of Drone-Based Air Quality Surveys

What Are the Top Air Pollution Detection Drones in 2026?
Applications and Limitations of Drone-Based Air Quality Surveys

Drones can map pollution changes across a block or above a road, where fixed monitors may miss local variation. Teams can pair compact particle and gas sensors with GPS, wind readings, and repeat flight paths. This helps locate roadside peaks, smoke layers, or changing concentrations near worksites. Useful, but not definitive.

The World Health Organization reported in 2022 that 99% of the global population lived in places where its air-quality guideline levels were not met. The Health Effects Institute and UNICEF’s State of Global Air 2024 estimated 8.1 million air-pollution-related deaths in 2021. These findings underscore the need for better local measurements, but a drone survey cannot replace calibrated ground monitoring.

Small sensors can drift. Humidity, vibration, rotor wash, and heavy payloads may affect readings or reduce flight time. Wind and sampling height also matter: one flight can capture a plume, then miss it minutes later. Reliable surveys record calibration checks, weather, flight altitude, and uncertainty, and compare results with nearby reference monitors. Even with careful procedures, interpreting a changing plume is not always straightforward.

top