What Is a Dashboard Instrument?

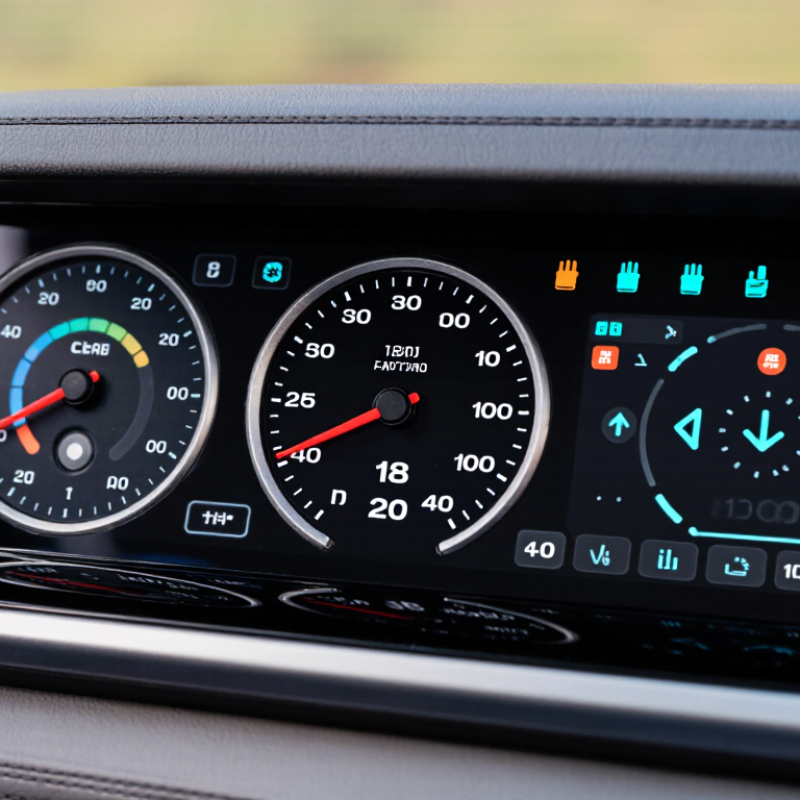
A Dashboard Instrument is the display or gauge system that helps a driver understand a vehicle’s condition while driving. It may include a speedometer, fuel gauge, warning lights, and digital messages. In newer vehicles, a screen can combine these readings with navigation or driver-assistance information. The central job remains simple: show important information clearly, at the moment it is needed.

That clarity matters on the road. NHTSA’s 2013 Visual-Manual Driver Distraction Guidelines recommend limiting individual off-road glances to two seconds and total task glance time to 12 seconds. The AAA Foundation for Traffic Safety has also reported that some navigation tasks using in-vehicle systems can take drivers around 40 seconds to complete. These findings concern broader in-car displays, not every instrument cluster. Still, they show why layout and readability deserve careful attention. A tiny warning icon can be hard to notice in bright sunlight; a crowded screen can make a quick check feel like work.

This guide explains what a Dashboard Instrument does, which components drivers commonly see, and how traditional gauges differ from digital clusters. It also considers warning indicators, visibility, and everyday usability. The answer is not always tidy: more screen space does not automatically mean better information. A well-designed instrument should make essential readings easy to find, without asking the driver to study the display. That distinction is easy to miss.
What Is a Dashboard Instrument?

Core Definition and Purpose of a Dashboard Instrument

A dashboard instrument is a vehicle display that turns operating information into signals a driver can read. It may show speed, engine temperature, fuel level, warning lights, or battery status. In older vehicles, separate gauges and lamps do this work; newer displays may combine them on one screen. The purpose is practical: help drivers monitor the vehicle and notice conditions that may need attention. A red temperature warning, for example, can prompt a driver to stop safely before overheating causes further damage. Small details matter. A symbol that is unfamiliar, or a gauge that is hard to read in bright sun, can make useful information less useful.

The display also sits within a wider road-safety challenge. NHTSA’s 2022 “Distracted Driving” Traffic Safety Facts report recorded 3,308 deaths in distraction-affected crashes. That figure does not measure dashboard-related distraction specifically, but it reinforces why vehicle information should be clear and quick to interpret. A good instrument layout prioritizes essential readings, uses consistent symbols, and avoids making routine checks feel like a search.

Not every driver reads a warning the same way, either; symbols can be easy to overlook. That part deserves more thought. A dashboard instrument informs, but it cannot replace attentive driving or proper vehicle maintenance.

Main Types of Dashboard Instruments

Dashboard instruments turn vehicle conditions into information a driver can read at a glance. The main types are analog gauges, digital instrument clusters, warning lights, and head-up displays.

Analog gauges use moving needles to show speed, engine speed, fuel level, or temperature. Their markings are easy to recognize, though small scales can be hard to read in dim light.

Digital clusters present similar information on screens, often with adjustable layouts. Warning lights and telltales use symbols or colors to signal conditions such as low fuel or an unfastened seat belt. They are not all the same: some indicate routine status, while others call for prompt attention. That distinction is easy to miss. Head-up displays project selected readings near the driver’s forward view, reducing the need to look down, but glare and poor positioning can still interfere.

Readability matters more than visual novelty.

NHTSA’s 2013 Visual-Manual Driver Distraction Guidelines use glance-duration criteria of two seconds or less per glance and 12 seconds or less of total eyes-off-road time for evaluated tasks. These are interface evaluation criteria, not a guarantee that every dashboard is safe.

In practice, clear labels, consistent warning colors, and uncluttered layouts help drivers find information quickly. A display can still feel confusing when too many readings compete for attention.

How Dashboard Instruments Measure and Display Information

What Is a Dashboard Instrument?

A dashboard instrument turns a physical condition into a reading a driver can use. A wheel-speed sensor detects rotation; the vehicle’s control system converts its signal into a speed estimate. A fuel gauge uses a float and sender to estimate the level in the tank. The display may be digital or mechanical, but the basic chain is similar: sense, process, show. Small errors can enter at every step.

The reading is not always a direct measurement. Outside temperature can lag after a vehicle leaves a warm garage, while a fuel gauge may move slowly to avoid reacting to fuel slosh. That delay is deliberate, but it can confuse people. Dashboard instruments are useful, not infallible.

Display design matters because drivers should understand information without staring at it. In its 2014 Visual-Manual NHTSA Driver Distraction Guidelines, the U.S. National Highway Traffic Safety Administration recommends limiting individual off-road glances to two seconds and total eyes-off-road time to 12 seconds for certain in-vehicle tasks. These are design benchmarks, not a guarantee of safety. Clear labels, stable readings, and familiar warning symbols help. Yet even a well-designed display can be misread when a driver is tired or the lighting is poor. That part deserves more attention.

Common Readings, Symbols, and Warning Indicators

What Is a Dashboard Instrument?

Common Readings, Symbols, and Warning Indicators

Dashboard instruments turn a vehicle’s changing conditions into quick visual information. The speedometer shows road speed, while the tachometer tracks engine revolutions. A fuel gauge estimates how much fuel remains; its small arrow may point toward the filler side. The temperature gauge helps reveal overheating, and an oil-pressure warning may signal that the engine needs immediate attention. Check the owner’s manual for the exact symbols and normal ranges in your vehicle. They can differ.

Warning lights deserve more than a passing glance. Red alerts often indicate a condition that needs prompt action, such as low oil pressure or a charging-system problem. Amber lights commonly flag issues that need checking, but color conventions are not universal. A flashing check-engine light can call for stopping safely rather than continuing the trip. Small clues matter. Even a familiar symbol can be easy to misread in dim light, and one brief glance may not explain the cause. Notice whether a light stays on, flashes, or appears with a message. If a reading looks abnormal, find a safe place to stop and consult the manual or a qualified technician. Don’t guess.

Factors That Affect Instrument Accuracy and Use

What Is a Dashboard Instrument?
Factors That Affect Instrument Accuracy and Use

A dashboard instrument turns sensor signals into information a driver can act on. Its accuracy depends on sensor condition, calibration, wiring, display resolution, and the vehicle’s operating environment. A speedometer, for example, may be affected by tire size or wear because these change how far the vehicle travels per wheel rotation. UNECE Regulation No. 39 sets a useful reference: a speedometer must not show less than the vehicle’s true speed, and its indicated speed is limited to true speed plus 10% and 4 km/h. The rule applies to vehicles covered by that regulation, not every instrument in every market.

Calibration records matter. NIST Technical Note 1297 explains that measurement uncertainty is commonly reported as expanded uncertainty using a coverage factor of 2, which often corresponds to about 95% coverage when the stated assumptions hold. That figure is not a guarantee for every dashboard reading. Temperature, vibration, electrical noise, and aging can still shift a result. Small changes matter.

A practical check should compare the displayed value with a suitable reference under stable conditions, then document the test conditions and uncertainty. A reading that looks steady may still be inaccurate. I would not treat one successful check as proof that an instrument will remain accurate across seasons, loads, or road surfaces. That limitation is easy to overlook.

top